What is Retention Rate?
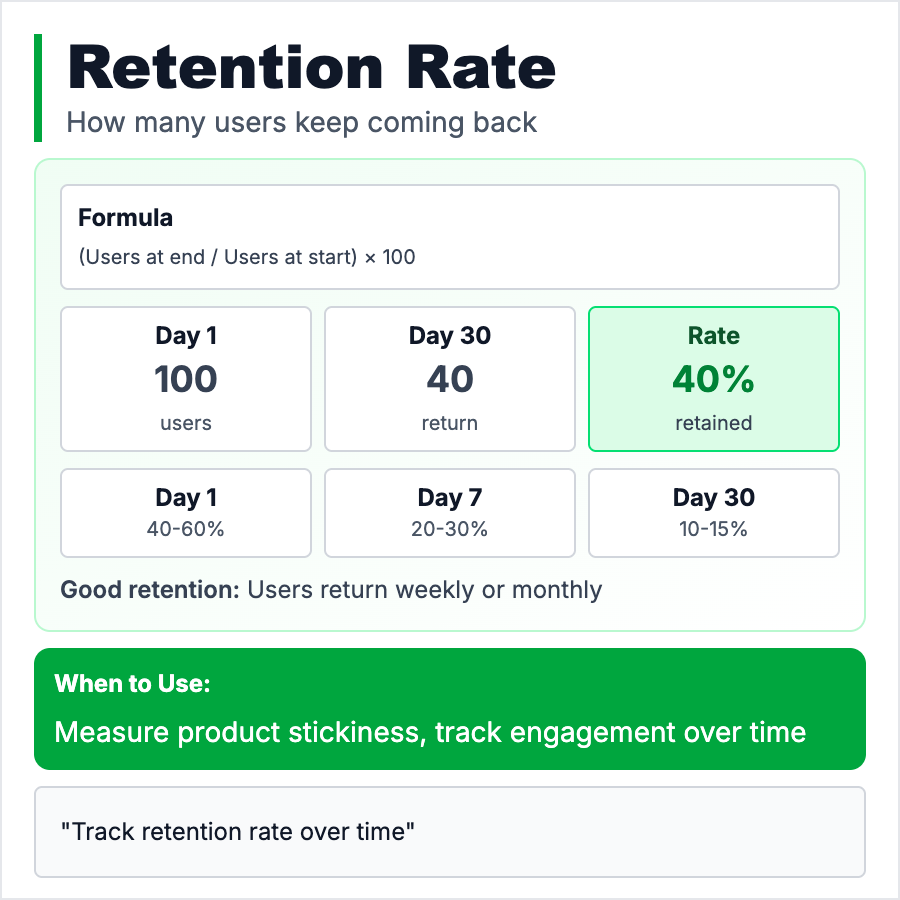
Retention Rate measures the percentage of users who come back after their first visit. Usually measured as Day 1, Day 7, Day 30 retention. If 100 users sign up and 40 return the next day, your Day 1 retention is 40%. Good retention varies: social apps target 60%+ Day 1, B2B tools might be 70%+, consumer apps often 20-40%. Retention is the #1 indicator of Product-Market Fit.
When Should You Use This?
Track retention from Day 1 of having users. It's more important than growth—if users don't come back, you don't have a product. Plot retention curves (% active by days since signup) to see if it flattens (good) or goes to zero (bad). Segment by acquisition channel, user type, and features used. Fix retention before spending on acquisition.
Common Mistakes to Avoid
- •Only looking at Day 1—track Day 7, Day 30, Month 6 to see long-term retention
- •Vanity metrics—1M signups means nothing if 99% churn in week 1
- •Not segmenting—power users have 90% retention, casual users 10%, average is misleading
- •Comparing to wrong benchmarks—B2B and B2C retention curves look totally different
- •Ignoring resurrection—some products have low retention but high "bring back" rate
Real-World Examples
- •Facebook at launch—90% Day 1 retention at Harvard, they knew they had PMF
- •WhatsApp—70%+ Day 1 retention, messenger network effects kicked in fast
- •Duolingo—60% Day 1 retention through gamification and streaks
- •B2B SaaS—Often 70-80% Day 1 (work tool), but 95%+ Month 6 (sticky once adopted)
Category
Product Management
Tags
retentionmetricscohort-analysisproduct-market-fitengagement