What is Drill-Down Dashboard?
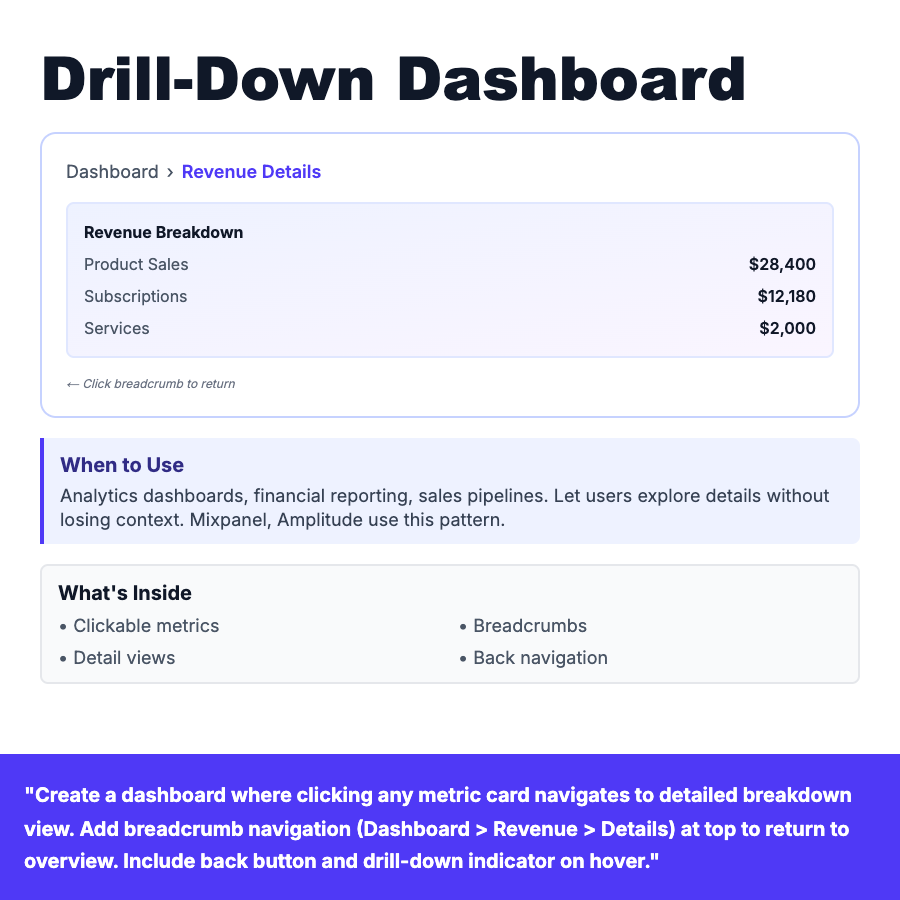
Drill-down dashboard allows users to click on any metric to see detailed breakdown. Uses breadcrumb navigation (Dashboard > Revenue > Details) to show hierarchy and enable quick return to overview. Detail views show granular data, charts, and sub-metrics. Common in analytics platforms like Mixpanel and Amplitude.
When Should You Use This?
Analytics dashboards, financial reporting, sales pipelines. When users need to explore metric details without losing context. Use breadcrumbs for navigation hierarchy. Include "back" button and preserve overview state. Good for dashboards with nested data (revenue → by product → by region).
Common Mistakes to Avoid
- •No breadcrumbs—users get lost in detail views without navigation
- •Losing filter state—preserve filters when drilling down
- •No hover affordance—show clickable hint on metric cards
- •Missing back button—only breadcrumbs isn't enough for mobile
Real-World Examples
- •Mixpanel—Click funnel step to see user cohort breakdown
- •Amplitude—Revenue metric drills into product category details
- •Google Analytics—Click traffic source to see specific referrers
Category
Dashboard Patterns
Tags
drill-downdashboardnavigationbreadcrumbdetail-viewhierarchical