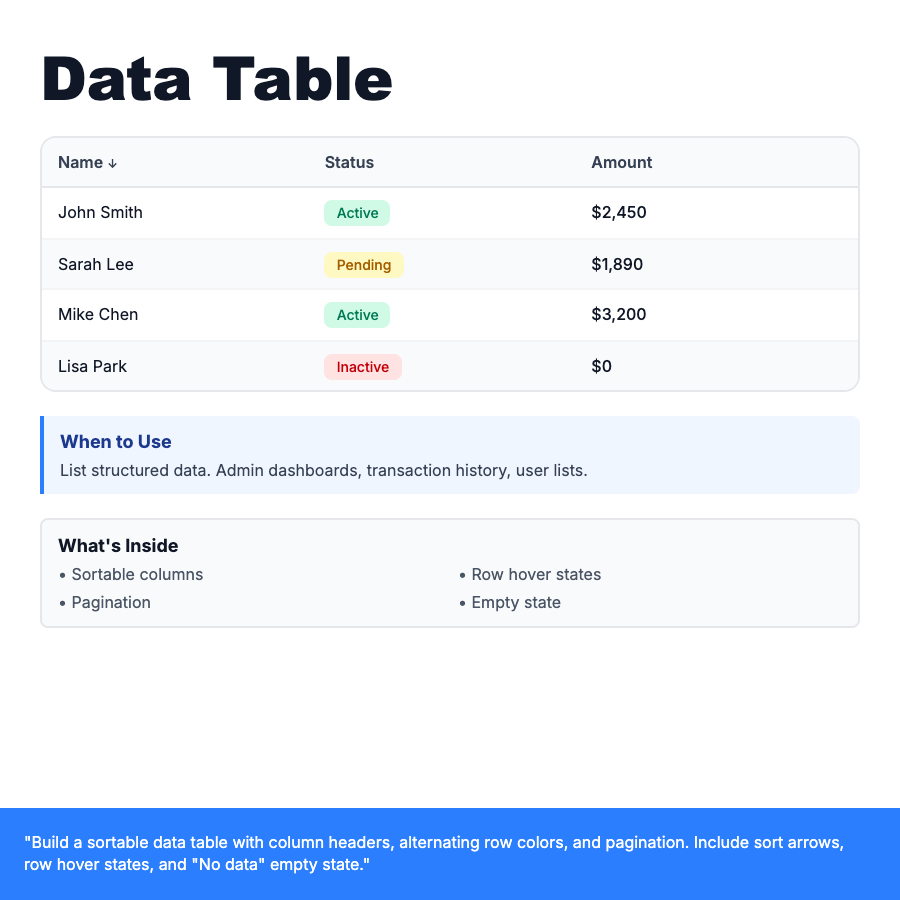
What is Data Table?
Data table displays structured data in rows and columns with interactive features: sortable columns (click header to sort ascending/descending), row hover states, alternating row colors for readability, and pagination for large datasets. Essential for admin dashboards, transaction history, user lists. Use sticky headers for long tables.
When Should You Use This?
Displaying structured data: user lists, transaction history, order management, analytics reports. Best for 10+ rows of multi-column data. Add sorting, filtering, search, and pagination for large datasets. Use row actions (edit, delete) for admin tables. Consider responsive alternatives for mobile (cards or simplified views).
Common Mistakes to Avoid
- •No sorting—users need to sort by different columns (date, amount, name)
- •Missing pagination—never show 1000+ rows on one page, limit to 25-100
- •Poor mobile design—tables don't fit mobile, use card layout or horizontal scroll
- •No empty state—show helpful message when no data matches filters
Real-World Examples
- •Stripe dashboard—transactions table with date, amount, status, customer columns
- •Admin panel—user table with email, role, status, last login, actions
- •Analytics—page views table with URL, visits, bounce rate, avg time sortable columns
Category
Data Visualization
Tags
data-tabletablegridsortablepaginationadmindata-viz