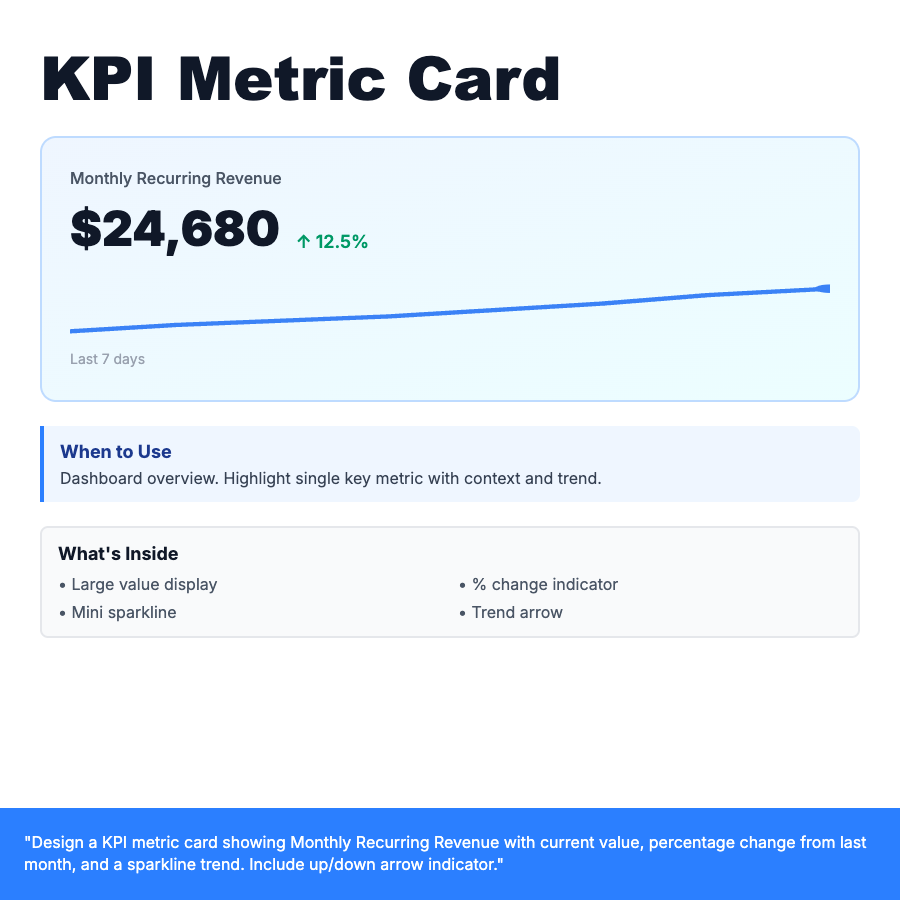
What is KPI Metric Card?
KPI metric card is a dashboard component highlighting a single key metric with large typography, percentage change from previous period, and mini trend visualization (sparkline). Shows current value, up/down arrow, % change, and compact line chart. Essential for executive dashboards and analytics overview pages.
When Should You Use This?
Dashboard landing pages showing critical metrics: MRR, active users, conversion rate, churn rate. Group 3-6 cards in a row for overview. Use green for positive trends (↑), red for negative (↓). Include comparison timeframe: "vs. last month", "vs. last week". Click card to drill into detailed chart.
Common Mistakes to Avoid
- •Too many metrics—highlight only 3-6 most critical KPIs on overview
- •No trend indicator—users need to know if metric is improving or declining
- •Missing comparison period—always specify "vs. last month" or similar
- •Inconsistent formatting—use same number format across all cards
Real-World Examples
- •SaaS dashboard—MRR, active users, churn rate, trial conversions with sparklines
- •E-commerce—daily revenue, conversion rate, average order value, cart abandonment
- •Marketing—leads generated, cost per lead, conversion rate, ROI
Category
Data Visualization
Tags
kpimetric-carddashboardanalyticsstatssparklinedata-viz